Operating Instructions
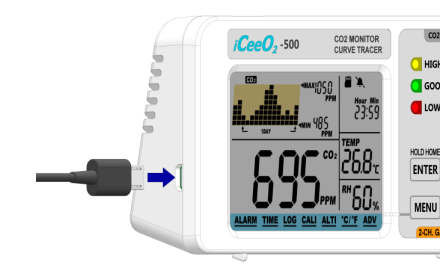
Initial Setup : When first unboxing, plug in the unit to the included Micro USB (or one of your own) to almost any cell phone charger or USB power source. If successfully connected, 3 things will happen while booting up:
 3 LEDs flash one by one
 Chart display shows the current software version & “Warm Up”
 Main display shows a countdown from 10
Once the countdown is complete, your product is ready to use. No initial setup or calibration is needed.

1. Plug in USB Power Cable
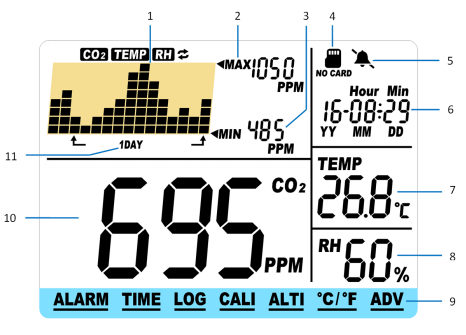
LCD Display

1. CO2/TEMP/RH Chart
2. Max Reading of Chart
3. Min Reading of Chart
4. Micro SD Card
5. Audible Alarm On/Off
6. Date and Time
7. Temperature Reading
8. RH Reading
9. Main Menu
10. CO2 Reading
11. Zoom Level of Time(indicates the chart’s span of time)
Trend Chart
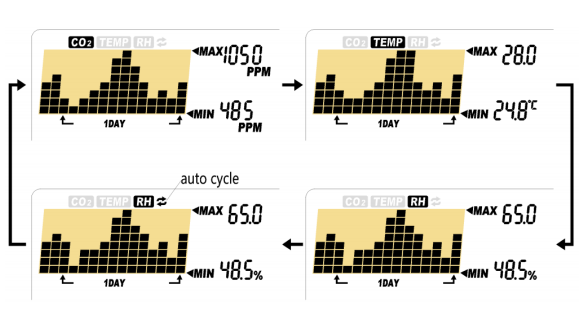
The trend chart (1) displays the past readings for CO2 and temperture and RH parameters.
That can be toggled by using DOWN key: CO2, TEMP, RH. As show below:

Trend Chart Zoom
Below is a table that show the available Zoom Levels for all parameters, as well as the duration of each division for corresponding Zoom Levels:
Zoom Level (Time Span) (11) | Time Per Division |
1MIN (minute) | 5sec /div |
1HR (hour) | 5m/div |
1Day (day) | 2h/div |
1WEEK(week) | 0.5d/div |
Using UP will toggle the available Zoom Levels for each parameters. Note that in addition to the Zoom Levels for each paramete.
Max/Min
At the top right corner of the display, there are two numerical indicators: Max (2)and Min (3). As the Zoom Level is changed, the Max and Min values will reflect the maximum and minimum values on the chart of the selected CO2 parameter. At startup, the unit will automatically display values for CO2.
Real Time
The real-time(6) display at the top right corner of LCD, user can adjust date and time by enter TIME mode.
SD Card For Logger
The device will record data logger by SD card while it existed. It’s can record Date, Time, CO2, Tempereture, RH, user can check and download logger by SD card reader.
Specifications
Typical test conditions, unless otherwise specified: Ambient Temp =23+/-3°C, RH=50%-70%, Altitude=0~100 meter
Measurement | Spec |
Operating Temperature | 32°F to 122°F (0°C to 50°C) |
Storage Temperature | -4°F to 140°F (-20°C to 60°C) |
Operating & Storage RH | 0-95%, non-condensing |
CO2 Measurement | |
Accuracy at 0~3000ppm | ±50ppm or ±5% of reading, whichever is greater |
Accuracy over 3000ppm | ±7% |
Repeatability | 20ppm at 400ppm (standard dev. of 10 readings in 1 minute) |
Measurement Range | 0-5000ppm |
Display Resolution | 1ppm (0-1000); 5ppm (1000-2000); 10ppm (>2000) |
Temp Dependence | ±0.2% of reading per °C or ±2ppm per °C, whichever is greater, referenced to 25°C |
Pressure Dependence | 0.13% of reading per mmHg (corrected by user’s altitude input) |
Response Time | <2min for 63% of step change or <4.6min for 90% step change |
Warm-up Time | <30 sec |
Temp Measurement | |
Operating Temperature | 32°F to 122°F (0°C -50°C) |
Display Resolution | 0.1°F (0.1°C) |
Accuracy | ±1°F (±0.5°C) |
Response Time | <20min (63%) |
RH Measurement | |
Range | 5-95% |
Accuracy | ±5% |
Resolution | 1% on Main Reading, 0.1% on Max Min Reading |
Power Requirements | 160mA Peak, 15mA average at 5.0V |
Dimension | 120*66*33mm (4.7*2.6*1.3inch) |
Weight | 103g ( 3.6oz) Device only, AC Adapter not included |